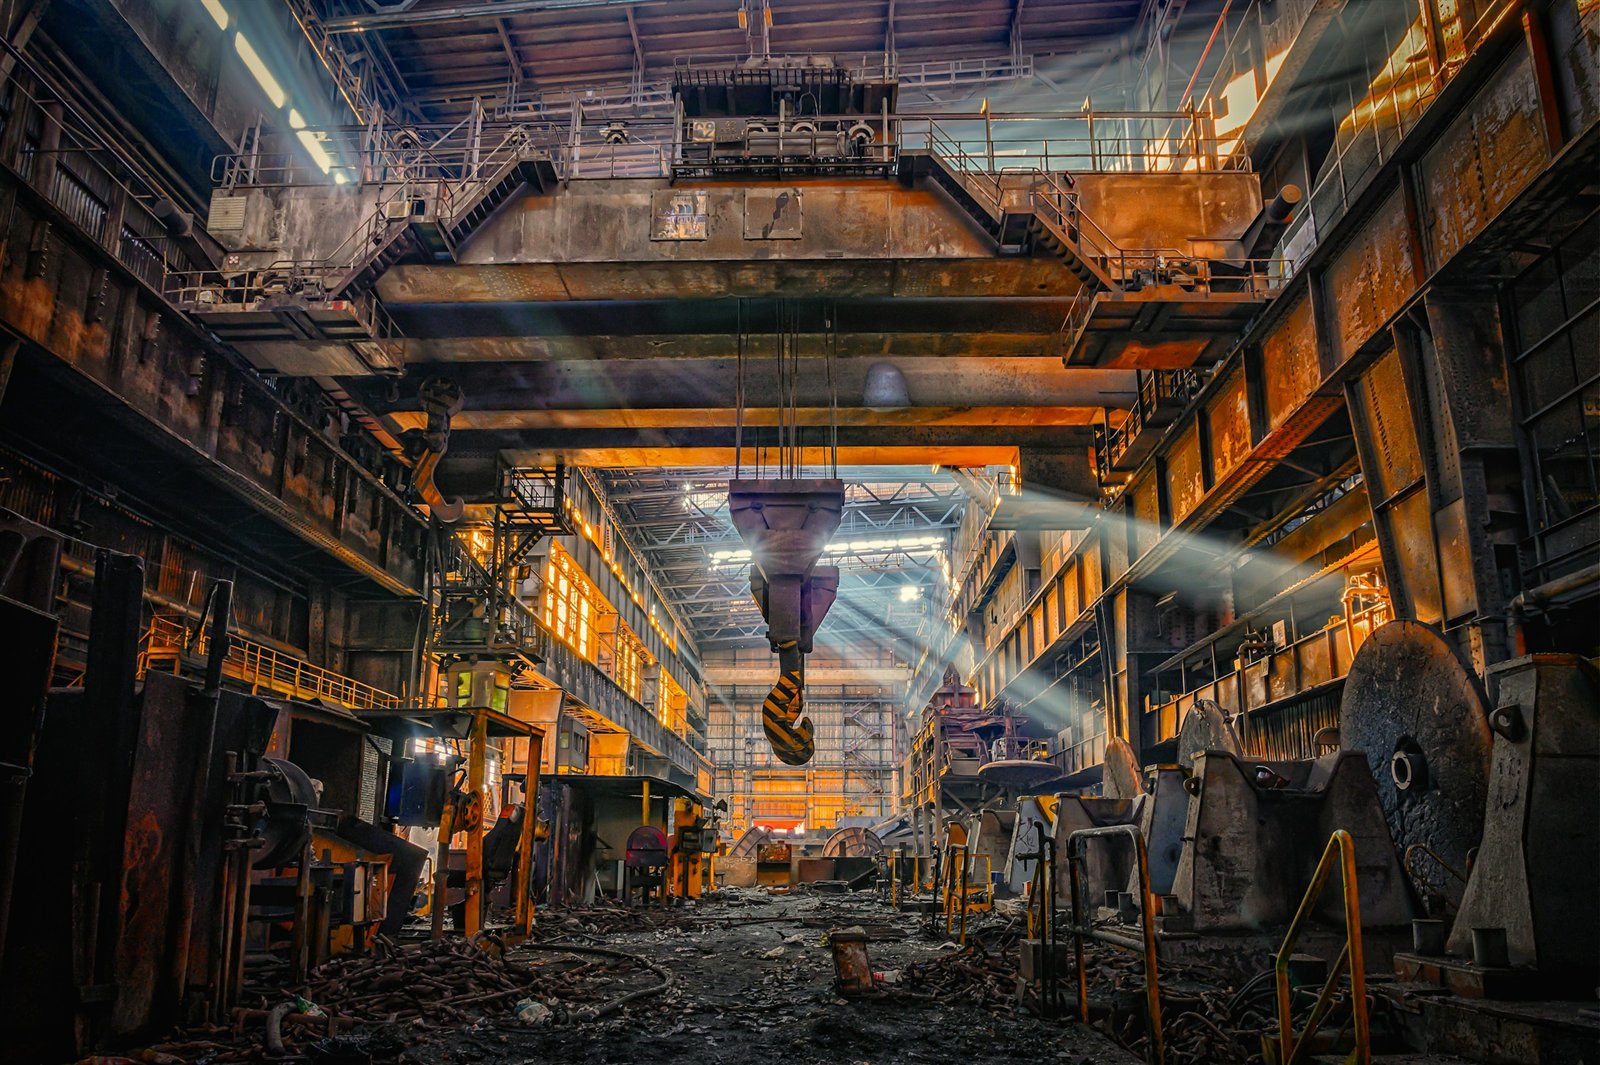
In March 2000, a fire at a Philips semiconductor plant in Albuquerque, New Mexico, damaged a cleanroom that supplied radio-frequency chips to two of the world's largest phone makers. Both Ericsson and Nokia bought from the same production line. Ericsson treated the plant as a reliable single source and waited for Philips's own assessment before acting. Nokia had a second qualified source already running and an escalation process that put engineers on the ground within days. Nokia lost weeks of margin. Ericsson lost an estimated few hundred million dollars in unfilled handset orders and exited the phone manufacturing business not long after. It went on to adopt a proactive supply chain risk management approach once the accident had exposed the vulnerability (Norrman and Jansson, 2004). The fire was the trigger, but the concentration of one critical input inside a single-source relationship was in Ericsson's supplier list well before it.
On 16 September 2025, in a more recent case with the same pattern, a fire damaged the hot mill at Novelis's plant in Oswego, New York, which reportedly supplies about 40% of the aluminium sheet the US automotive industry uses. A second fire followed on 20 November, and the mill restarted only in June 2026. Ford reported a $2 billion headwind and said it would keep sourcing finished materials from the plant and from other suppliers. Both cases raise the same question: how can an organisation tell whether a supplier base that looks diversified is in fact concentrated where it matters?
The vanity metric
Risk can be defined as the effect of uncertainty on objectives (ISO 31000, 2018), which implies that concentration matters only where a supplier's failure would affect an objective. Measured against that definition, a count of active suppliers is a vanity metric. An organisation can hold two hundred active suppliers and still be one plant fire away from a crisis, because two hundred is a count across the whole book. Risk distributes unevenly across a book, and it tends to concentrate inside whichever category is both critical and thin. A distribution business might have forty suppliers of packaging materials and exactly one supplier of the specialist component that goes into its highest-margin product line. The forty would reveal nothing useful about the one that matters.
Enterprise risk management can integrate risk with strategy and performance (COSO, 2017), which points to a more useful question: of the spend or dependency that would hurt if it stopped, how much of it comes from how few suppliers? That question may need asking separately for each risk tier, because concentration inside a Critical tier is a different conversation from concentration inside Low. A Critical tier concentrated in one supplier is a single point of failure in the place where it can do the most damage, while the same concentration inside Low may simply be an efficient procurement decision. So the tier in which concentration falls, as much as the concentration figure itself, decides whether it needs action.
A number that can be calculated
The US Department of Justice and Federal Trade Commission measure market concentration with the Herfindahl-Hirschman Index (HHI): each player's share of a market is squared and the results are summed. A market with one player scores 10,000, and a market with a hundred equal players scores 100. US merger guidance treated a market above 2,500 as highly concentrated (U.S. Department of Justice and Federal Trade Commission, 2010), and later lowered that threshold to 1,800 (U.S. Department of Justice and Federal Trade Commission, 2023). The same formula can be applied internally, one risk tier at a time: each supplier's share of spend or dependency within the tier is squared, and the squares are summed. Run tier by tier, the score cannot be flattered by forty packaging suppliers hiding one sole-source component. It may show whether "diversified" is true for the tier that matters or only true on average.
Worked example (illustrative)
Three suppliers make up the Critical tier of a fictional distribution company's risk register: a sole-source component supplier, an IT hosting provider and a specialist subcontractor. Their share of Critical-tier spend:
| Supplier | Share of Critical spend | Share² |
|---|---|---|
| Sole-source component supplier | 45% | 2,025 |
| IT hosting provider | 35% | 1,225 |
| Specialist subcontractor | 20% | 400 |
HHI = 2,025 + 1,225 + 400 = 3,650
In the example, two of those three suppliers, the hosting provider and the subcontractor, were already carrying open, escalated findings on the risk register. A high HHI may explain why problems at individual suppliers in that tier land harder than they would in a properly diversified one, since there is little slack in the tier to absorb a single failure.
What the number does not show
Ford's statement that it would keep sourcing from Novelis, alongside other suppliers, suggests that concentration is not always abandoned even after it fails. Concentration can be the right call: a single strategic partner might offer better quality control, tighter protection of intellectual property or economies of scale that a fragmented supplier base cannot match. An HHI score is therefore best read as a trigger for a conversation. It is most useful for making concentration a decision someone made, with the risk understood, where otherwise it accumulates silently while nobody measures it. The failure it guards against is undiscovered concentration, discovered for the first time when the single point fails.
The same options Nokia had
Nokia's response in 2000 shows the options available once a Critical-tier HHI comes back high. They are the same tools that belong to Stage 8, exit or replacement planning, of a properly run third-party risk lifecycle:
- Qualify a warm second source even if it never takes live volume, so the requalification clock has already been run before it is needed
- Size safety stock to the requalification lead time of the concentrated input, since that is the specific gap a concentration failure creates
- Diversify geography or jurisdiction where the concentration risk is a single site or a single regulatory regime
- Negotiate step-in rights and IP escrow so a sole-source failure does not also mean losing the ability to make or specify the item
- Revisit the classification itself: if a Critical-tier input has been single-sourced for years without incident, that is worth checking against Stage 2 of the lifecycle
Each of these steps can be taken while keeping a good supplier relationship, since none requires ending the relationship that created the concentration. They require knowing, in a number, that the concentration exists before a fire, a shortage or a regulatory change forces the discovery. Nokia's second source cost money to keep qualified and running for years before it was ever needed. That was the price of not finding out the hard way.
Before the fire
The measures above differ in cost, and which one fits matters less than whether anyone owns the number that would trigger them. A concentration score for each Critical-tier category, held by a named owner, turns a vague unease into a figure that can be tracked. Next to the time it would take to requalify a second source, that figure shows whether safety stock covers the gap or only postpones it, and whether the concentration is in one company or also in one site, geography or regulatory regime. Ericsson's exposure was one company at one site. My own view, from years of account work, is that a long record without incident is the weakest reason to leave a sole-source input unreviewed, since Ericsson held exactly that record until March 2000.
The arithmetic left unread
Diversification, on this evidence, can be tested only tier by tier, and a supplier count on its own may conceal the concentration that matters. Ericsson's exposure came down to one number nobody had calculated: how much of a critical input depended on a single relationship at a single site. Nokia had in effect priced the same risk into the second source it kept running. The Herfindahl-Hirschman Index offers a way to turn that difference into a number before the fire. It leaves room for concentration where concentration is the right commercial choice, and it is most useful for showing whether concentration in a Critical tier was a decision someone made or a position that accumulated while nobody was counting. Novelis and Ford suggest the same exposure still plays out, on a different continent and in a different material. The arithmetic that would flag it is simple to run on an organisation's own supplier data.
The views expressed here are my own and are based on general observations about third-party risk and supply chain concentration. They draw only on published sources and do not represent the position of the Royal Navy, the Ministry of Defence or any organisation with which I work. Nothing published here reproduces any organisation's internal policy, procedure or assurance output. The worked example is entirely fictional; no real supplier, client or organisation is described.
References
- Norrman, A. and Jansson, U. (2004), "Ericsson's proactive supply chain risk management approach after a serious sub-supplier accident," International Journal of Physical Distribution & Logistics Management, Vol. 34 No. 5.
- U.S. Department of Justice and Federal Trade Commission (2010), Horizontal Merger Guidelines (HHI thresholds: above 2,500 highly concentrated).
- U.S. Department of Justice and Federal Trade Commission (2023), Merger Guidelines, 18 December 2023 (HHI above 1,800 highly concentrated): ftc.gov (opens in a new tab).
- Manufacturing Dive, "Novelis restarts Oswego hot mill months after fires," June 2026: manufacturingdive.com (opens in a new tab).
- Fox Business, coverage of the Novelis Oswego fire of 16 September 2025 (the plant's share of US automotive aluminium sheet is reported, not officially stated): foxbusiness.com (opens in a new tab).
- CNBC, "Another fire ignites at Ford aluminum supplier Novelis," 20 November 2025: cnbc.com (opens in a new tab).
- ISO 31000:2018, Risk management — Guidelines.
- COSO, Enterprise Risk Management — Integrating with Strategy and Performance, 2017.